The past 20 or more years of research in innovation management has brought up of metrics. In practical terms most of them are either unspecific, superficial, not relevant enough for your business or simply not available.
Still, research plenty gives a hint what metrics are used frequently and how they are structured.
Looking at past research there is no shortage of metrics and KPIs (key performance indicators) though. In a recent survey (1) over 200 metrics and indicators were mentioned in more than 400 instances of literature. They can be classified by the
- process phase: comparing input, throughput and output metrics, often called leading or lagging indicators
- area of measurement: related to product development, strategy, organisation etc.
- expression in qualitative or quantitative terms.
Drawing up the last decades of academic articles and their interest in KPIs looks as follows:
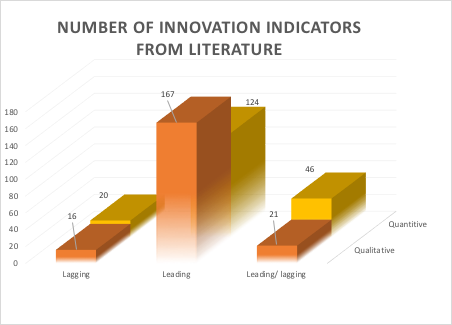
Qualitative metrics leading the innovation process dominate academic research (2).
It is interesting to observe that leading indicators are much more abundant than lagging indicators, which means measuring output and outcome. Leading metrics on their own typically measure strategy-related things, for example, how much is invested in R&D or certain new product lines. As resource allocation is crucial it often makes sense to track such metrics. Unfortunately, they disconnect at later stages.
Here, the combined metrics come to rescue, because they carry the strategic intent forward and allow to measure throughput as well as output and outcome. For instance, instead of measuring R&D spend, the allocation of overall investments from development to marketing segmented by strategic product groups is more helpful. It allows to track early investments as well as outcomes in the same categories. Instead of product groups we can also think of adoption cycles (percentage of new launches) or customer segments.
Innovation Metrics in Detail
Let us also look at which metrics are most popular in academia:
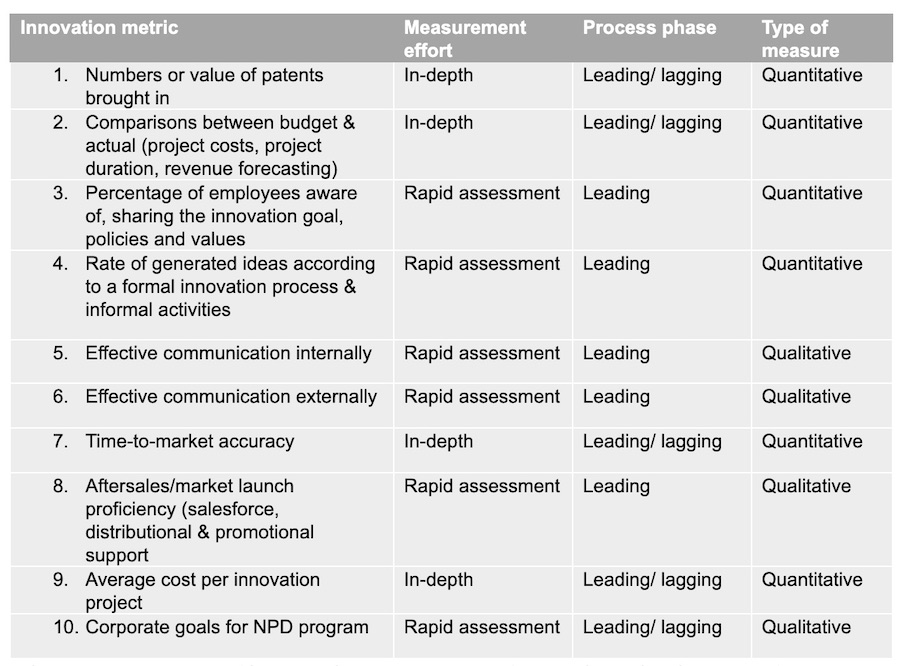
Those top-10 KPI covered by more than 5 peer-reviewed research articles show a good mix across classifications, however, they should also be assessed whether they provide a good baseline for continuous measurements (e.g. alongside an innovation board portfolio, such as innovation portfolio and balance).
Many of them also support the idea of continuous KPIs. While patents are very specific and certainly do not reflect overall innovation, the metric supports many stages from ideation to commercialisation. For an R&I-oriented (Research & Innovation) organization this could be a good fit.
Important top-30 metrics include further measures such as:
- Portfolio alignment
- Rate of product ideas approved for stage
- Collaboration with customers, suppliers, competitors, universities
- Portfolio balance
- Average innovation project development time
- R&D intensity (absolute & relative)
- Commitment of resources
- Average number of innovation projects working hours
- Formal post-launch evaluation procedures
- Adherence to a commercialisation schedule
- Technology novelty
- Organisational climate
- Commitment to risky projects (senior management)
- Customer satisfaction indicators for new products
- Recognition of key problems that must be solved with skills that reside outside the organization
- Product planning horizon (years, product generations)
Recommendations for Using Innovation Metrics: Throughput Matters
In practice, measuring all kinds of leading parameters with only a superficial measurement is creating more confusion than clarity.
We recommend using only a few simple metrics but use them across the stages of the process. For example, if you go for patent value then you should look at the conversions of that value over time. This could be patents submitted in ideation, patents filed, granted and finally used in products (or licensed out). The latter stage is well suited if you prefer value over numbers.
Here’s an example table to give you some inspiration on how to get started:
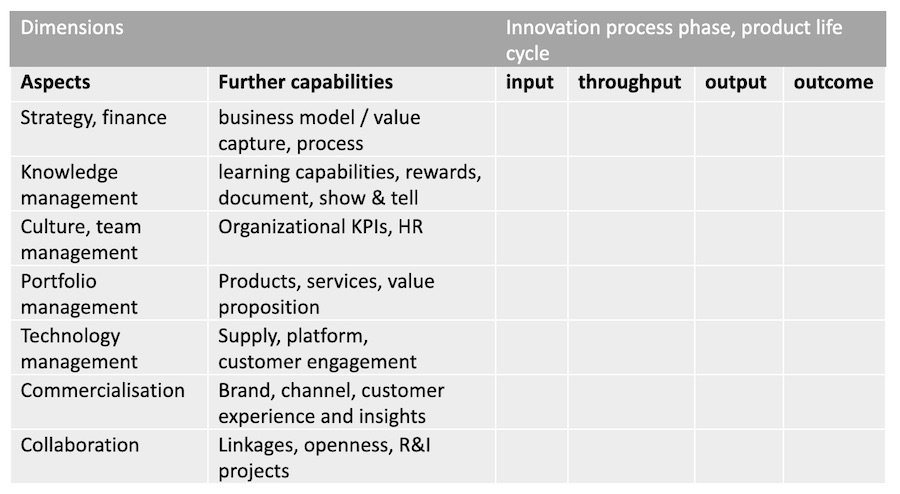
Remember to think of metrics that connect the investment to the outcome. Or start at the end and find your way back to the source of the impact and outcome. Also spend some time to assess which metrics are captured along the product life cycle.
The typical process to work on this is a structured collection and workshop with a resulting metrics “cloud” that can be assessed in a 2×2-matrix of relevance and effort.
If you struggle to focus you should pick higher-level metrics and just go for throughput. Throughput of ideas converting into a paid service gives an ideal value metric. If it is not a paid for product another measure of consumption is needed such as click-through, usage time or selection preference.
Second, the maturity of an innovation organisation should be assessed first to see which drivers are most important. For instance, a “beginner” organisation having just introduced an innovation process might want to add learning metrics (e.g. trainings performed as input and methods applied in projects as throughput metric). A more mature organisation may shift focus on steering, setting challenges and incentives on the input side while diving deeper in outcome metrics such as sales of certain product and service categories.
Finally, some metrics are typical marketing or R&D KPI (e.g. budget/actuals of projects and time to market) that can be easily enriched with innovation metrics.
About the author
 Dr. George Fankhauser is a partner and innovation consultant at Sensaco GmbH in Zürich Switzerland. He has more than 20 years of experience in software and product development. His work in innovation management is focused on frameworks, processes, and the application of digital tools.
References
-
- Nappi, Vanessa & Kelly, Kevin. (2018). Key Performance Indicators and Dimensions for the Innovation Process. 25th Innovation and Product Development Management Conference, Porto.
- Survey data from osf.io.


